HOW TO READ THE DEBT CLOCK: And What The Debt Clock is Revealing Right Now…By Lynette Zang
I frequently get questions about the numbers revealed by the US Debt Clock. It’s no wonder with all those rapidly spinning numbers. But these numbers are telling a very important story and you could think of them as a countdown to the explosion of the debt bomb we are all sitting on.
I’d also like to say that there may be some different ways to approach some of the fields shown in the debt clock, but they all still point to the same ugly truth, that the end of the current debt based system grows nearer every day.
Have more questions that need to get answered? Call: 844-495-6042
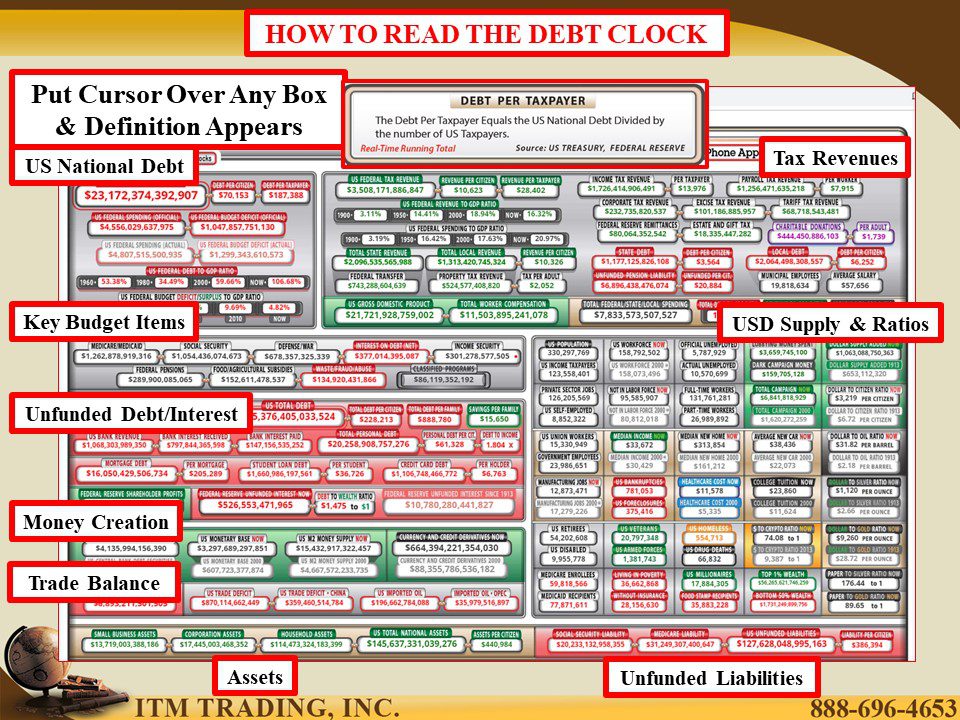
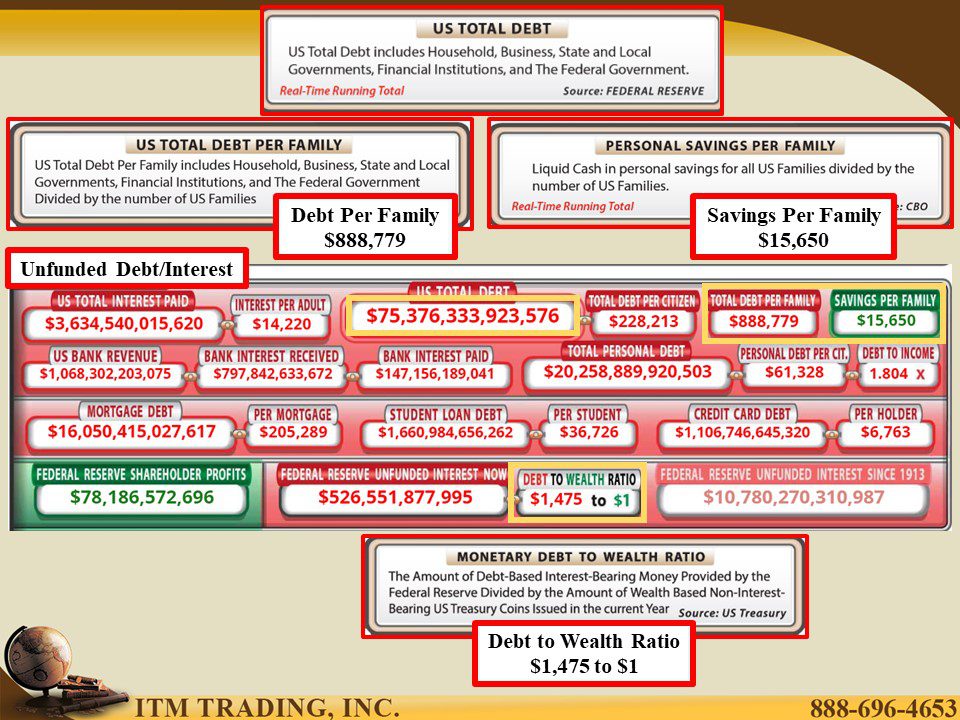
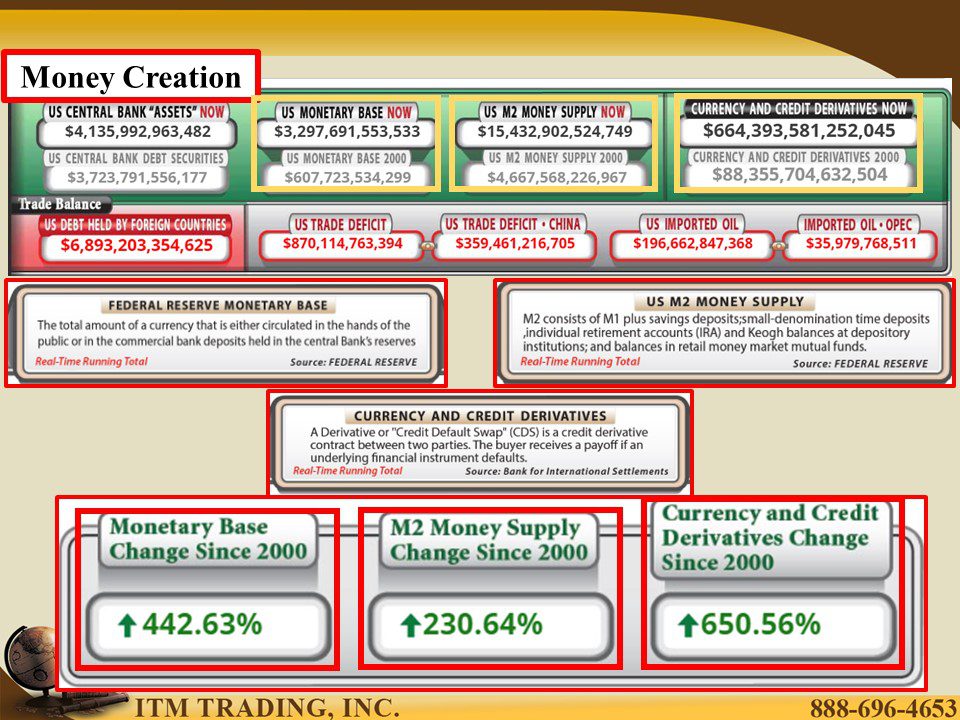
To help you understand what you’re looking at, they’ve broken their clock into sections that cover debt, revenues, key budget items, unfunded debt/interest, money creation, trade, assets and unfunded liabilities. For clarity, unfunded refers to obligations that do not have sufficient funds set aside to pay the debt.
Further, to understand the calculations behind those rapidly rising numbers, just put your cursor over any cell and the definition appears at the top of the page where the US Debt Clock banner sits.
While all the information held here tells an important story, I’ve broken out key areas for our review.
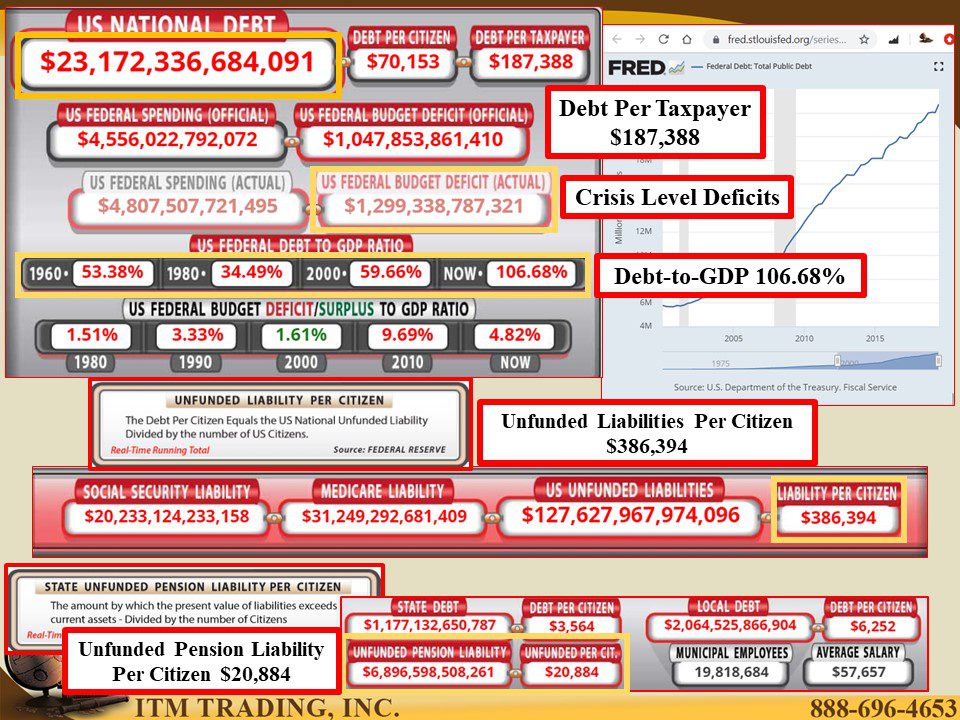
When people hear about US national debt, they aren’t sure why that matters to them. It does, because politicians are spending your money and they tax you to generate the revenue to pay those obligations. What does not come in from current tax revenues, gets funded with debt that is supposed to be paid with future revenues. At the time I pulled the images, the current debt per taxpayer was $187,388. Did you realize you owed this debt?
Not only that, but the government is spending so much more than current tax revenues, that deficit spending is back to the crisis levels last seen in 2013 and debt-to-GDP (Debt to all the money that flows through the economy) is at historically high levels. To put this into perspective, it would be like you spending more than your gross (before taxes and deductions) paycheck and funding the deficit with credit cards.
This might be OK for a little while, but if this behavior becomes chronic, you will go bankrupt. In addition, it can only last as long as there are those willing to extend you credit.
But that $187,388 is only what is currently due, additionally, there are unfunded liabilities for social programs (SS and Medicare) that total $386,394, unfunded state pension liabilities of $20,884, to mention a few more. The bottom line, when all debts were totaled up to the moment I pulled the image, total debt per family was $888,779 and growing. Can you see why this is unsustainable and cannot continue forever?
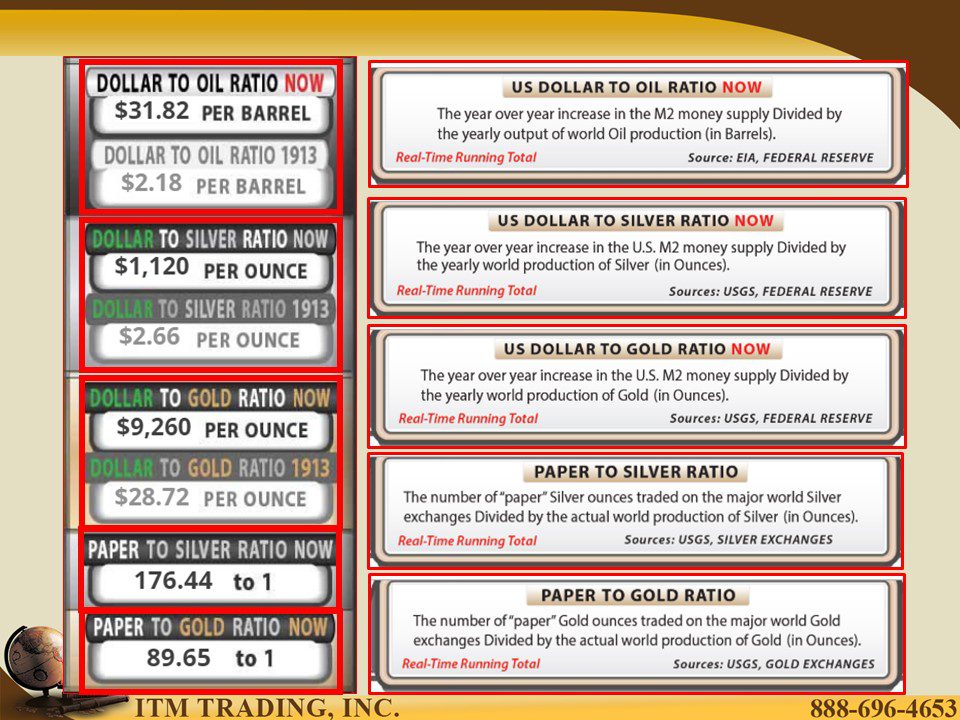
Of course, most of the questions I get are on the gold and silver ratios, which I believe are there to reveal the fundamental value of the physical metals, or where the price may go during the upcoming currency reset.
At the moment, I pulled this image, the USD to Silver ratio was $1,120 per ounce. That number is based on the YOY increase in the US M2 money supply (which is not the broadest base of new money, just the one that is published by the Federal Reserve) divided by the yearly world production of silver. Additionally, the Paper to Silver ratio shows that for every 1 ounce of physical silver mined, there are 176.44 paper silver ounces traded.
For gold we see the same pattern. The USD to Gold ratio was $9,260 per ounce based on the YOY increase in the M2 money supply divided by yearly world production. The Paper to Gold ratio reflects the number of gold contracts traded on exchanges divided by gold production.
I must reveal that I use a different methodology based upon all the debt created to determine the fundamental value. But this information is not easily available and likely would not provide the constant data required for a continuous debt clock. Additionally, neither method can guarantee the exact ultimate number, but both can give you a reasonable idea of true value.
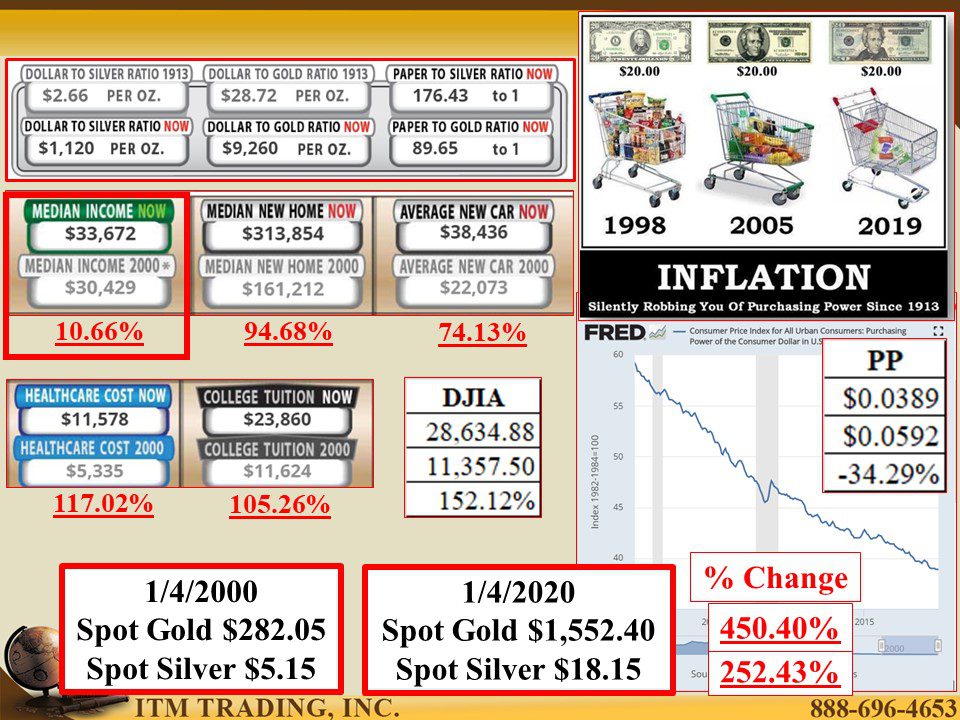
Either way, what you can clearly see is that both gold and silver are severely undervalued. Their day to rise to their true value lies ahead, don’t you want to own them when that happens?
Slides and Links:
https://www.usdebtclock.org/index.html
https://fred.stlouisfed.org/series/GFDEBTN
https://www.gold.org/goldhub/research/gold-demand-trends/gold-demand-trends-q3-2019